Financial Analysis of AI: A Guide to Smart Investment Decisions
Publicerad July 9, 2025 av Joel Thyberg

Hello and welcome. In this post, and in our accompanying interactive tool, we'll walk through a financial analysis that shows how we can make smarter, data-driven investment decisions when it comes to Artificial Intelligence.
A smart investment decision is fundamentally about maximizing results, meaning our budget gets us the most capable AI models possible.
Because while there are many ways to deploy an AI, there are essentially only three financial models to pay for it: Buy, where you make a direct investment in your own hardware; Rent, where you rent dedicated server power by the hour in the cloud; and API, where you pay per call, based entirely on your actual usage.
Understanding when each option is most advantageous gives you the chance to utilize AI to its full capacity for every dollar invested. With the right strategy, you can both minimize costs and maximize the impact of your investment.
Option 1: API – Pay-per-Use (The Taxi)
The first and perhaps most flexible option is to pay per call via an API. Think of it like taking a taxi: you only pay for the ride you take, no more, no less. Payment is based on "tokens" – small pieces of text that the AI uses to understand your questions (input) and formulate answers (output).
The price varies significantly, just like with taxis where a ride in a Toyota is cheaper than one in a Rolls Royce. The same principle applies to AI models: the smarter and more capable the model you use, the higher the cost per token. For example, a simple question to a "dumber" model might cost fractions of a cent, while a complex answer from a top model like GPT-4o costs considerably more. A general rule is that it's more expensive to get an answer (output) from the model than to ask it a question (input).
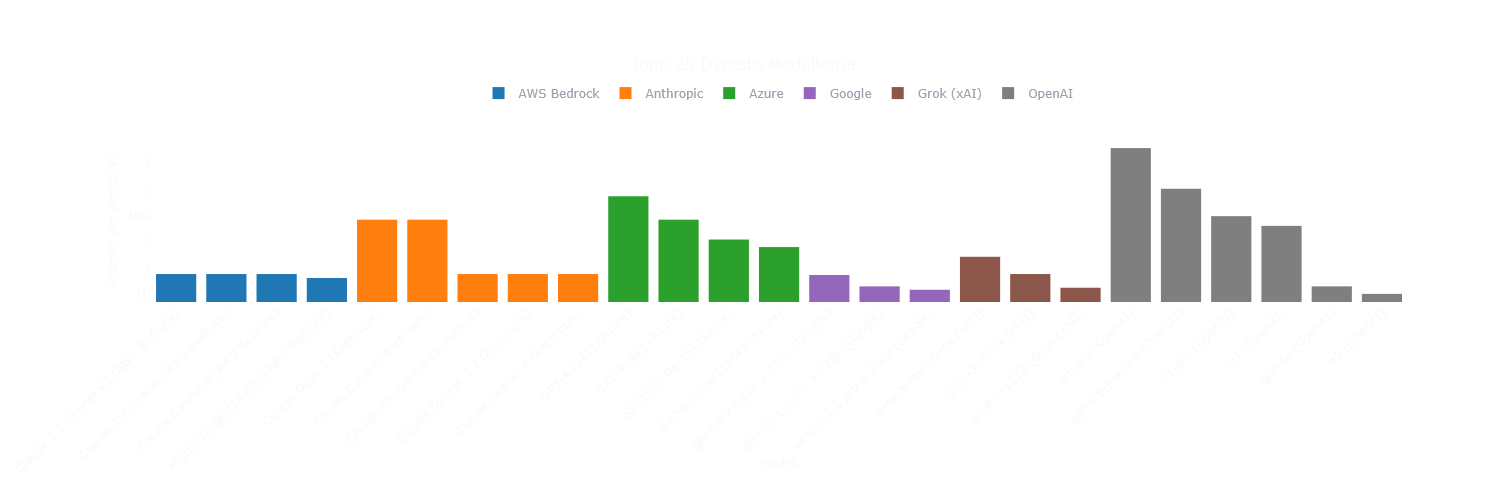
The graph above clearly illustrates this, showing the price differences for the market's most expensive models.
But there is an important and positive detail in the pricing. When we analyze the relationship between a model's size (number of parameters) and its cost, we see a clear pattern.
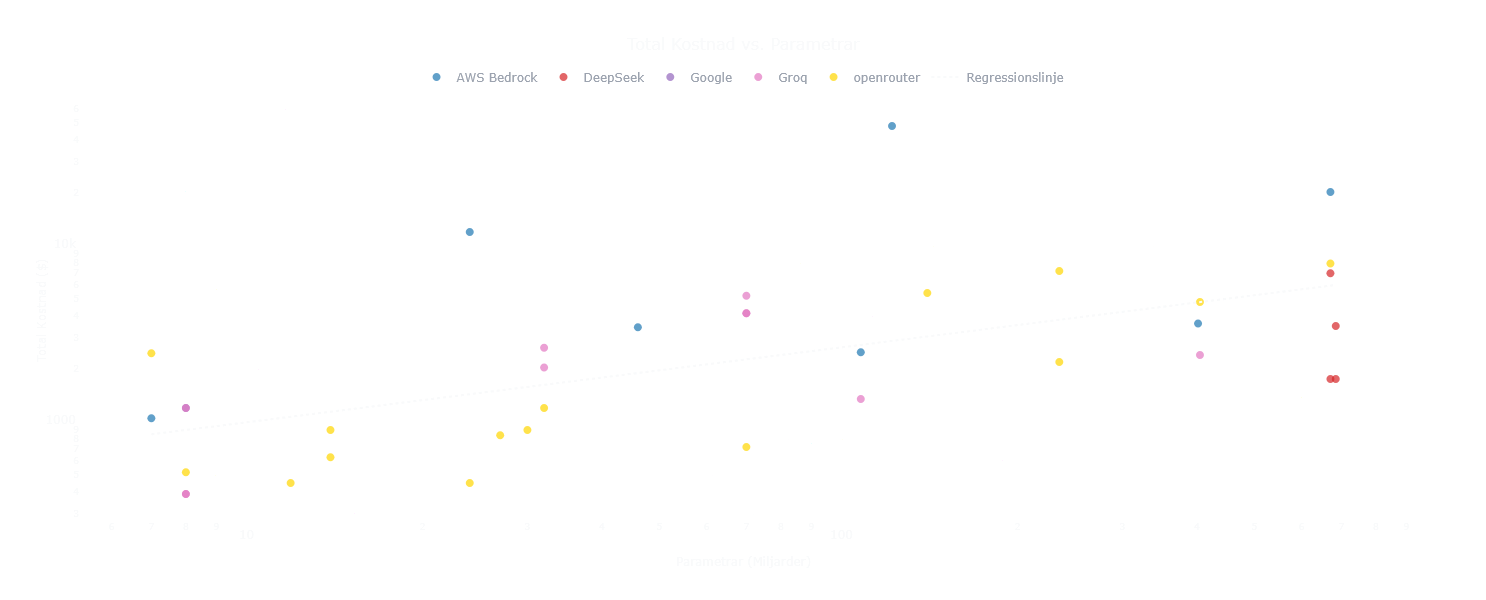
You might think that a model that is ten times more powerful would also be ten times more expensive, but that's not the case. The analysis shows that you get a kind of "volume discount" on performance. The price certainly increases, but it grows significantly slower than the model's capability. Larger models thus give you more "performance per dollar." This is a crucial insight for understanding the API economy.
With this understanding, let's move on to the next option.
Option 2: Rent a GPU server (The Rental Car)
The second option is to rent a dedicated server with a powerful GPU, allowing you to run AI models privately. This is similar to renting a car: you pay by the hour. The more performance (a more luxurious car) you want, the higher the hourly rate.
To understand this market, we have analyzed the relationship between the hourly price and the performance you actually get. Performance here is measured in VRAM (video memory), which is the decisive factor for how large and capable AI models you can run.
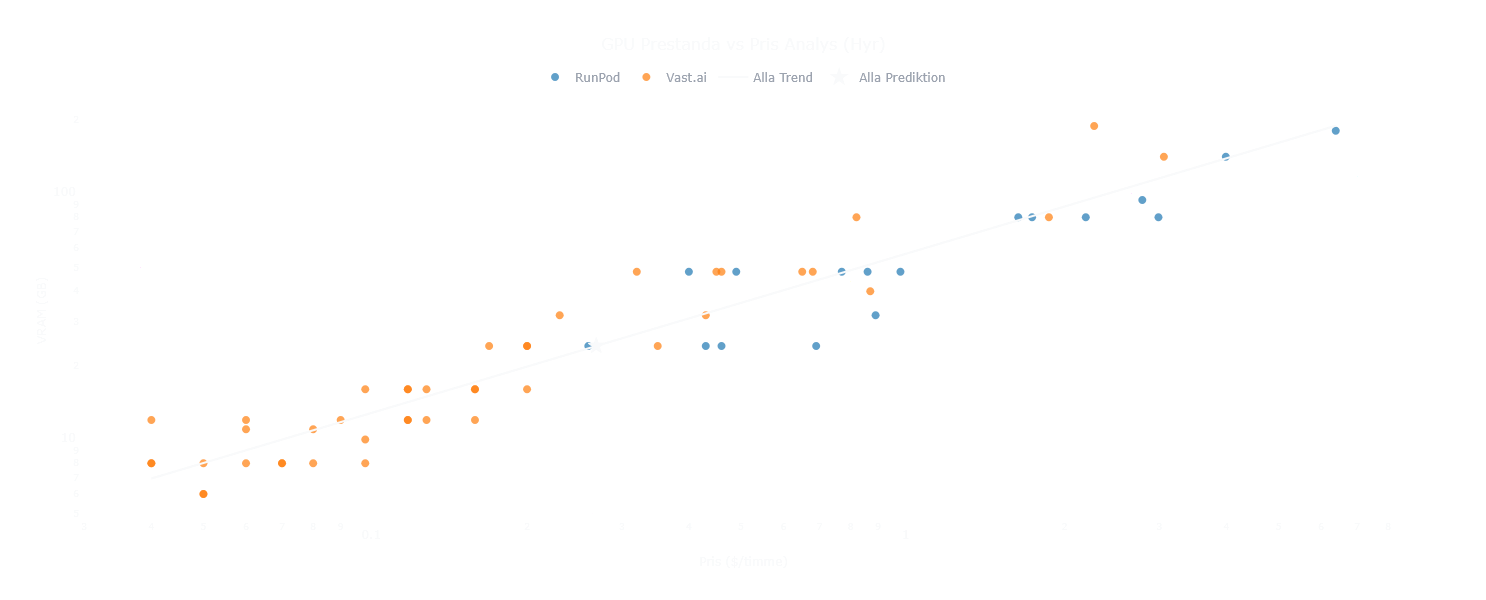
Here we see a pattern that is the exact opposite of the API option's "volume discount." In the rental market, you instead get diminishing returns. The analysis clearly shows that if you double your hourly rate, you do not get twice as much VRAM. More expensive "premium servers" thus give you less performance for every extra dollar you invest.
This is an important insight: scaling up by renting more expensive servers means the "value per dollar" decreases.
Option 3: Buy your own GPU (Owning the Car)
The third and final option is to buy your own hardware. This is like buying a car: you make a large one-time investment, but after that, you own it and can drive as much as you want without ongoing costs per mile. The performance (VRAM) you buy on day one is what you have access to throughout the hardware's lifespan.
But what do you actually get for your money when you buy? We have analyzed the relationship between purchase price and VRAM for a wide range of graphics cards.
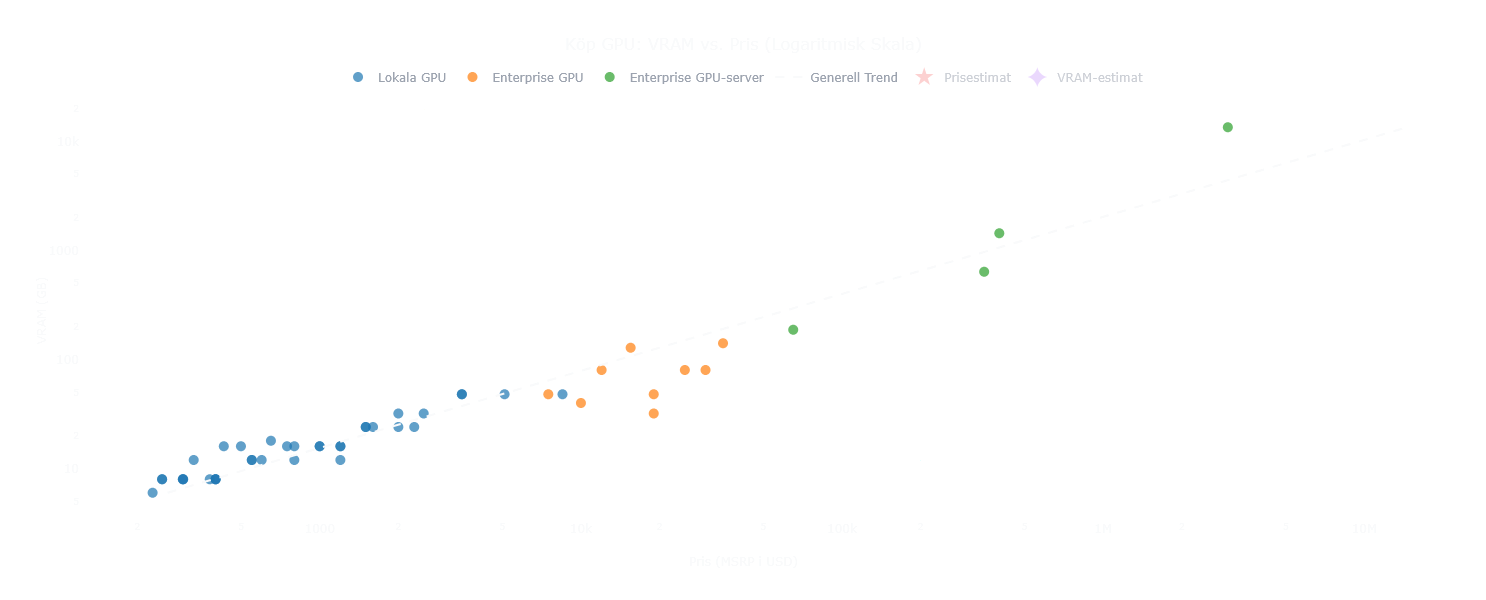
Here we discover a third, unique economic pattern. If the API market offered a "volume discount" and the rental market gave "diminishing returns," the purchase market instead has a kind of "luxury tax".
The analysis shows that the price of graphics cards increases much faster than the performance (VRAM). This means that if you want an absolute top-tier card with an extreme amount of VRAM, you pay a disproportionately high price. Doubling your budget gets you nowhere near double the VRAM.
This pattern is the opposite of what we saw in the API market.
Now that we understand the unique economy of each individual option – the API's "volume discount," the rental market's "diminishing returns," and the purchase market's "luxury tax" – it's time to pit them against each other. The first thing we'll do is look at three concrete scenarios where we compare them based on budget and usage.
Scenario 1: Low Budget, Low Usage
We start with the most common scenario for many small businesses and startups: a starting budget of $1,000, with 1,000 input tokens and 1,000 output tokens per API call, and 100 calls per day.
(To put this in perspective: 1,000 input/1,000 output tokens is roughly what you can expect for standard questions without long pasted text. So 100 calls per day means 100 regular questions daily, while 10,000 calls per day in our later scenario means 10,000 regular questions daily.)
Before we look at the numbers, we need to understand a crucial dynamic: how time affects what we actually get for our money.
- Buy is simple: We buy a piece of hardware for $1,000. The performance is fixed and constant over time.
- Rent & API are more complex: Here, our $1,000 budget must last for the entire period we are analyzing. The longer the time horizon we plan for, the more the budget has to be "thinned out." For Rent, this means a lower hourly rate, resulting in a weaker server. For API, it means we have to choose a cheaper (and dumber) model for each individual call.
With this in mind, what does this mean for our car metaphors in this scenario?
- Buy becomes our Volvo: We buy a reliable car for $1,000. It's ours to use as we wish, with fixed performance.
- Rent becomes our Toyota: With a $1,000 budget stretched over 10 months, we can't afford to rent a Porsche. We can afford a stable but less powerful Toyota.
- API becomes our Luxury Taxi: This is different. Since we only pay for 100 short trips a day, we can still afford a very luxurious taxi (a top-tier model) for each trip without the budget running out for many years.
So, how does an owned Volvo compare to a rented Toyota and a luxury taxi?
Break-even points for Scenario 1:
- Buy vs. Rent: 304 days (approx. 10 months)
- Buy vs. API: 18,153 days (almost 50 years)
- Rent vs. API: 87,270 days (almost 240 years)
Conclusion: The result is striking. The luxury taxi (API) is completely superior. The reason is simple: at low usage, it's an incredibly inefficient use of money to own or rent a car that mostly sits idle in the garage, compared to just paying for the few trips you actually make.
Scenario 2: High Budget, Low Usage
Now we keep the low usage (100 calls/day) but increase the budget to $100,000. The same time dynamic applies, but with more capital, our choices change:
- Buy becomes a Rolls-Royce: A huge one-time investment in luxury and performance.
- Rent becomes a Porsche: We can now afford to rent a real sports car by the hour.
- API becomes a Bugatti: With the same low number of trips, we can now pay for the absolute most exotic "taxi" on the market.
Break-even points for Scenario 2:
- Buy vs. Rent: 205 days (approx. 7 months)
- Buy vs. API: 453,823 days (over 1,200 years)
- Rent vs. API: 8,726,968 days (almost 24,000 years)
Conclusion: Parking a Rolls-Royce or a Porsche in the garage is an even greater waste of capital than with a Volvo. The API option becomes even more unbeatable, as the fixed cost of the other options is so massive relative to the low usage.
Scenario 3: Low Budget, High Usage
Here we flip everything: a low budget ($1,000) but extremely high usage (10,000 calls/day).
- Buy (Volvo): The car is the same, but now we're driving it constantly. The fixed cost per trip suddenly becomes very low.
- Rent (Toyota): The rental car is also used constantly, making the fixed daily cost more justified.
- API (Tuk-Tuk): To handle 10,000 trips a day on a low budget, we are forced to choose the absolute cheapest "taxi" available. Despite this, the total daily cost quickly becomes unsustainable.
Break-even points for Scenario 3:
- Buy vs. Rent: 304 days (approx. 10 months) - unchanged
- Buy vs. API: 182 days (approx. 6 months)
- Rent vs. API: 149 days (approx. 5 months)
Conclusion: High usage reveals the API model's weakness. The break-even points show a clear strategy over time: API is most advantageous in the very first months. After that, Rent becomes the smartest choice (profitable after about 5 months), and for long-term operation of nearly a year, it's almost always best to Buy.
From Scenarios to Strategy: The Big Picture
Manually testing every conceivable budget and usage scenario, as we just did, is both insightful and cumbersome. We need to see the whole picture to create a general strategy.
And that's exactly what the next step in the analysis does. Instead of us inputting a specific budget, the tool tests hundreds of budgets from $1,000 to $1,000,000 and directly shows us how the break-even time changes. The logic is to create a more "fair" comparison: for a given budget, we calculate the absolute best performance you can buy, and then we compare it to what it would cost to rent or use an API for the exact same performance level.
When we do this, however, we discover something that at first seems completely contradictory.
The Great Paradox: Why Buy Scales Better Despite Worse Value?
Remember our earlier conclusions?
- The API market: Had a "volume discount" (b=0.43). Larger models became relatively cheaper.
- The Buy market: Had a "luxury tax" (b=1.42). Larger hardware became relatively more expensive.
The question then is: If API scales better on paper, why will our final analysis show that Buy is often the better option to scale up with?
The answer is not just about how fast costs grow (the scaling), but about their absolute starting point. Let's explain with a concrete example:
Scenario: You need "100 Performance Units"
- Option 1 (API): Using a service with "100 Performance Units" costs $30 per day.
- Option 2 (Buy): Buying a GPU that provides "100 Performance Units" costs $3,000.
- The Break-even Point: $3,000 / $30 per day = 100 days.
The Challenge: Now you need "1,000 Performance Units" (10x more)
- Option 1 (API) again: Thanks to the "volume discount," the service with 10x more performance is not 10x more expensive. It now costs $120 per day (only 4x more expensive).
- Option 2 (Buy) again: Due to the "luxury tax," a GPU with 10x more performance is not 10x more expensive, but costs $40,000 (a full 13.3x more expensive).
The New Break-even Point:
$40,000 / $120 per day ≈ 333 days.
| Small Scenario (100 Performance) | Large Scenario (1,000 Performance) | |
|---|---|---|
| Purchase Price | $3,000 | $40,000 (more than 10x more expensive) |
| Daily API Cost | $30 | $120 (only 4x more expensive) |
| Break-even Time | 100 days | 333 days |
Here we see the paradox in plain text: Even though the API price got a fantastic "volume discount" and the GPU price got a terrible "luxury tax," the final break-even time is not 10 times longer. It's only about 3.3 times longer.
This shows that the API's pricing looks better when scaling, but its absolute cost per day is so fundamentally high from the start that the buy option still wins the "scaling battle" in the end.
With this crucial insight in hand, let's look at how these trends play out in practice.
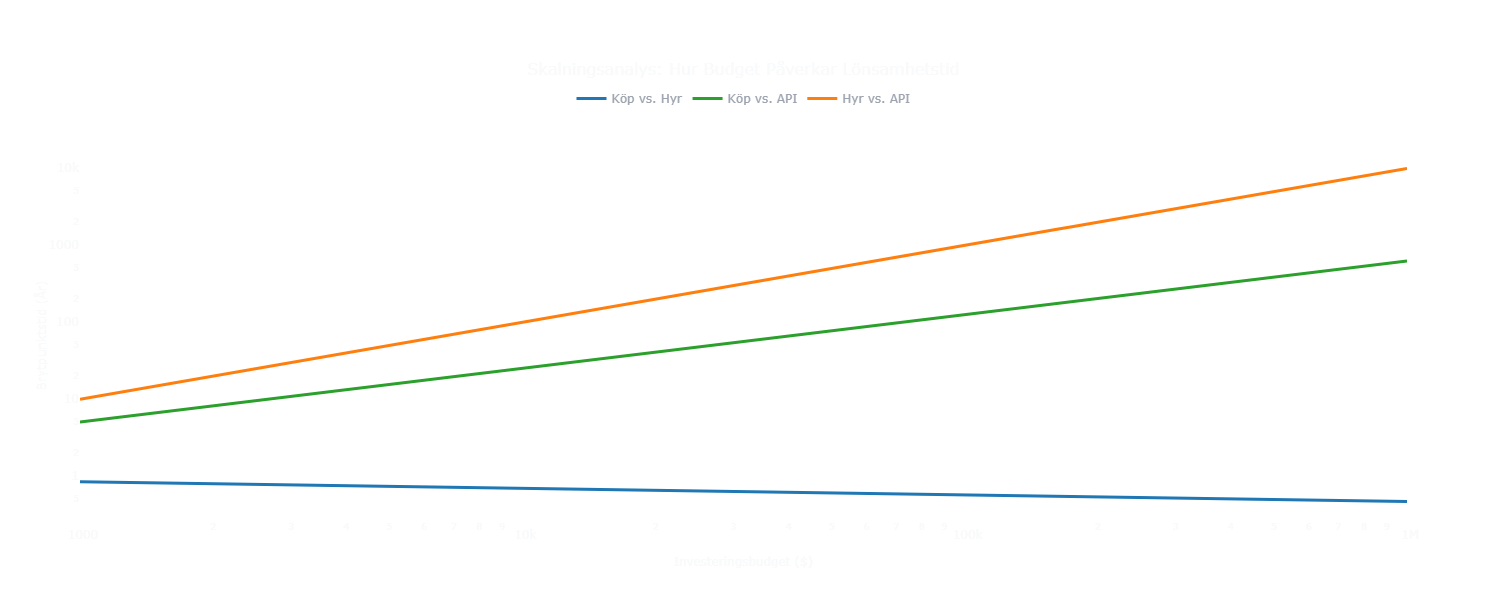
The Three Scaling Trends Explained
When we analyze how different budgets affect the break-even time, we get three fascinating trends:
1. Buy vs. Rent (Slope: -0.09) Extremely favorable! Higher budget = SHORTER break-even time
Why negative?
- Buy gets more VRAM per dollar at higher budgets
- The rent market has poorer economies of scale
- Larger budgets make buying even more attractive
2. Buy vs. API (Slope: 0.70) Favorable. Break-even time grows slower than the budget
Why positive but under 1.0?
- API's good scaling (0.43) helps but isn't enough
- Buy's high starting cost compensates for poor scaling (1.42)
- Larger budgets make buying relatively better
3. Rent vs. API (Slope: 1.00) Perfectly linear. Double budget = double break-even time
Why exactly 1.0?
- Rent's scaling effect (0.65) and API's (0.43) cancel each other out
- The result is perfectly proportional scaling
Usage Analysis: When Token Volume Drives Everything
The second perspective flips the question: For a fixed budget, what happens when usage (token volume) increases?
Let's analyze this with a concrete example: a budget of $1 million.
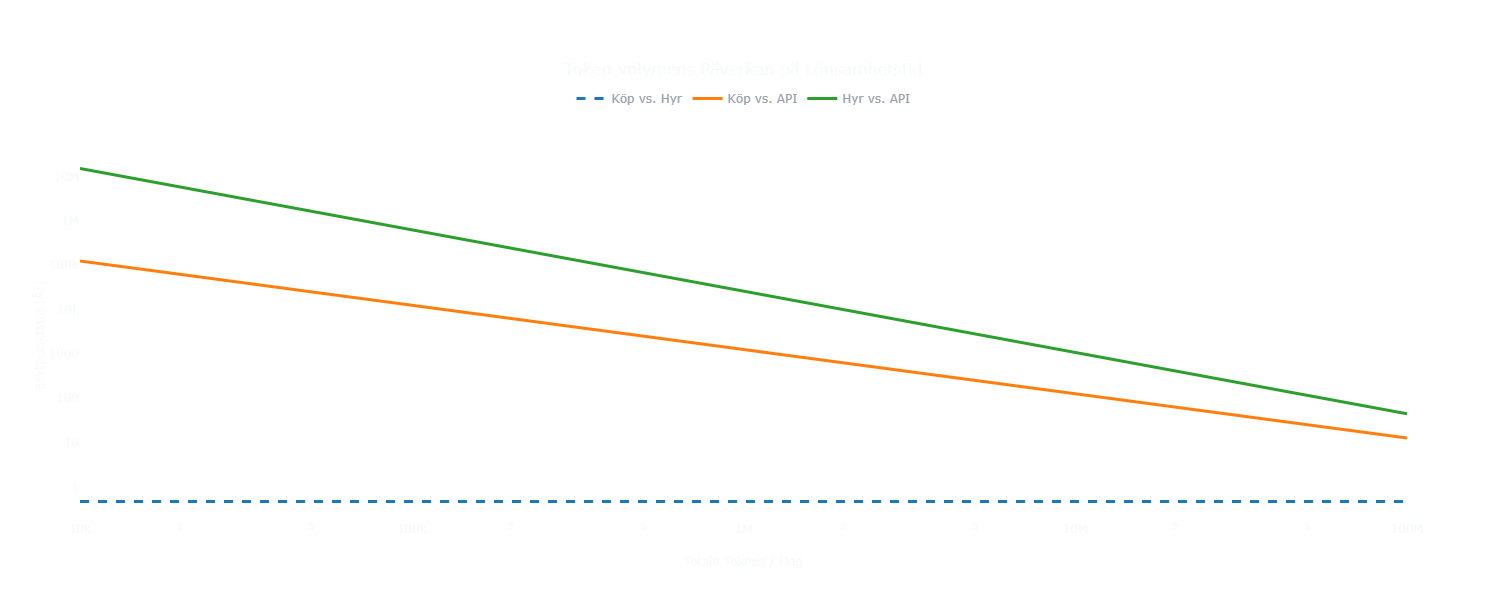
What does the chart show?
Buy vs. Rent (Slope: 0.00)
- Flat line: This comparison is not affected by API usage at all
- Logic: It's a pure hardware calculation - no matter how much you use APIs, the relationship between buying vs. renting hardware doesn't change
- Constant break-even time: About 0.6 years (approx. 7 months)
Buy vs. API (Slope: -1.00)
- Perfect linear scaling: 10x more tokens = 10x shorter break-even time
- Logic: The API cost scales exactly with usage, so double usage = double cost = halved time to break-even
- Example: At 100,000 tokens/day it takes 10 years, at 1,000,000 tokens/day it takes 1 year
Rent vs. API (Slope: -1.38)
- Faster than linear: 10x more tokens = more than 10x shorter break-even time
- Logic: The rent option becomes even more attractive at high usage because the chosen API model is particularly expensive for the performance you get
- Example: At 100,000 tokens/day it takes 30 years, at 1,000,000 tokens/day it takes only 1.2 years
Practical insights:
Low usage (under 100,000 tokens/day):
- API dominates for decades - it's the obvious strategy
- Buy and Rent only become relevant after an extremely long time
Moderate usage (100,000 - 1,000,000 tokens/day):
- API starts to become problematic within 1-10 years
- The buy option becomes relevant for long-term projects
High usage (over 1,000,000 tokens/day):
- API becomes unsustainable within months to a year
- Both buy and rent become necessary almost immediately
The Heatmap Analysis: The Complete Decision Matrix
Now we move from individual scenarios to the big picture. By combining all budgets (from $1,000 to $10,000,000) with all usage levels (from 10,000 to 100,000,000 tokens/day), we get three powerful heatmaps that show exactly where the break-even points lie for every conceivable situation.
1. Buy vs. Rent: The Time Horizon Decides
What the heatmap shows:
- Vertical color fields: All columns have the same color - token volume does not affect the comparison
- Only the budget matters: Larger budget = shorter break-even time
- Break-even range: 4 months (million-dollar budget) to 12 months (thousand-dollar budget)
Interpretation in plain language:
| Budget Level | Break-even Time | Practical Consequence |
|---|---|---|
| $1,000 - $10,000 | 10-12 months | Projects over a year: buy. Under a year: rent |
| $10,000 - $100,000 | 6-10 months | Buying pays off for most business projects |
| $100,000+ | 4-6 months | Buying becomes attractive even for medium-term projects |
Practical decision rule:
- Projects under 4 months: Always rent, regardless of budget
- Projects over 12 months: Always buy, regardless of budget
- Projects 4-12 months: Weigh the security of a lower initial cost against the hassle of owning hardware
2. Buy vs. API: The Diagonal that Divides the World
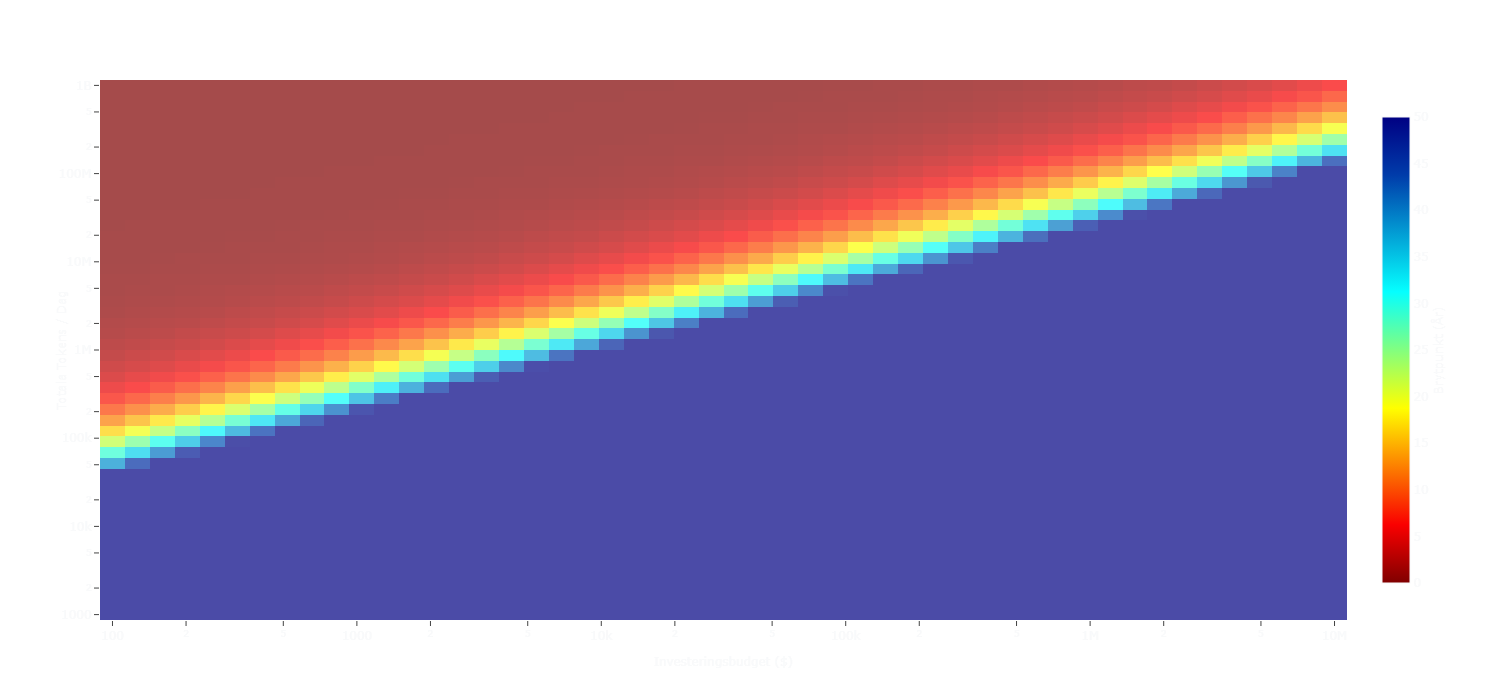
What the heatmap shows:
- Clear diagonal: The line starts at ~100,000 tokens/day and a $100 budget
- The line ends: At ~500,000,000 tokens/day and a $10,000,000 budget
- Three distinct zones: Blue (API wins), yellow-green (even), red (Buy wins)
Interpretation of the zones:
| Zone | Color | What it means | Practical Consequence |
|---|---|---|---|
| Below the diagonal | Blue | API never more expensive than buy | Choose API regardless of timeframe |
| On the diagonal | Yellow-green | Equal cost after 7 years | Buying only pays off for 10+ years of operation |
| Above the diagonal | Red | Buy pays for itself | The higher above the line, the faster the payback |
Practical decision matrix:
- Find your position: Combine your budget (X-axis) with expected token volume (Y-axis)
- Below the line: API is the obvious choice for almost all time horizons
- Above the line: Buying becomes more profitable the further above the line you are
- Red zone: Five times above the line = break-even in about 1 year instead of 7 years
3. Rent vs. API: The Most Favorable Comparison
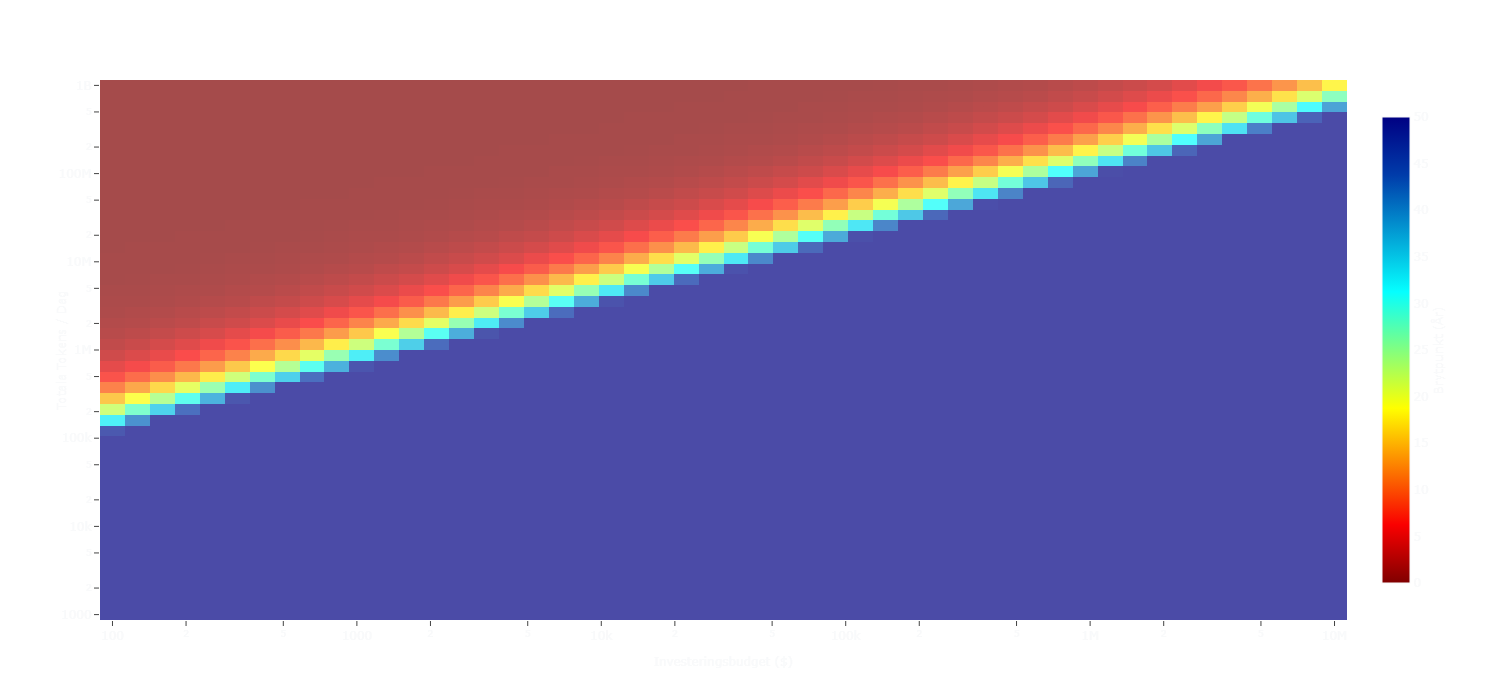
What the heatmap shows:
- Diagonal starts: At ~300,000 tokens/day and a $100 budget
- Diagonal ends: At ~1,000,000,000 tokens/day and a $10,000,000 budget
- Wider red zone: Rent wins more often than buy against API
Interpretation of the zones:
| Zone | Color | What it means | Practical Consequence |
|---|---|---|---|
| Below the diagonal | Blue | API is cheapest for many years | Choose API for irregular usage |
| Above the diagonal | Red | Rent pays for itself in the first year | The higher above the line, the faster the ROI |
Practical decision rule:
- Find your position: As before, combine your budget (X-axis) with your expected token volume (Y-axis).
- Compare with the Buy map: Note that the red zone here starts at a lower token volume. This means Rent becomes profitable faster than Buy when compared to API.
- High usage: If you are far above the diagonal, Rent becomes an extremely cost-effective alternative to API for handling high, continuous traffic without the large one-time cost of a purchase.
Conclusion: Your Strategic Decision Guide
So, how do you navigate this complex landscape to make the best decision? The answer always lies in the dynamic interplay between two factors: your time horizon and your expected usage volume.
Instead of separate rules, think of it as a decision process:
Start by evaluating your situation through two lenses:
-
The lens of extreme usage: If your usage is very low and sporadic, the answer is almost always API. Paying for hardware (Buy or Rent) that sits idle is rarely economically justifiable. If your usage is extremely high (over a million tokens/day), the API cost quickly becomes unsustainable. Then the question is not if you should have your own hardware, but whether you should Buy or Rent.
-
The lens of extreme time horizon: If your project is very short (under four months), the large initial investment of a Buy is almost impossible to justify. The choice is then between Rent and API, which is decided by your usage. If the project is very long (over a year) and has stable, high usage, Buy becomes the most economical option in the long run.
For everything in between, the heatmap is your definitive guide. The map lets you see the exact outcome of the interplay between your budget and your token volume. Find your position: if you are above the diagonal line, some form of hardware (Rent or Buy) is preferable to API. The further above the line you are, the faster the investment pays off.
Don't forget the hidden costs. Remember that a Buy also entails costs for electricity, cooling, and maintenance (often +20-30% of the purchase price per year), which must be factored into your final calculation.
The smartest strategy is rarely one that locks into a single option. It is dynamic: start with API to quickly prototype and test, switch to Rent when scaling to handle increased traffic without tying up capital, and finally, when the system is proven and stable, Buy your own hardware for maximum long-term profitability.
With these tools and insights, you are now equipped to make smart, data-driven decisions that maximize your AI investment and minimize unnecessary costs.
Thanks for joining this deep dive into AI economics!